
首页 /
正文
vue3封装echarts
1. 封装hooks传入dom元素返回echart实例
import * as echarts from 'echarts'

export default function (el: HTMLElement) {
  // 初始化echart实例
  const echartInstance = echarts.init(el)

  // 设置选项
  const setOptions = (options: echarts.EChartsOption) => {
    echartInstance.setOption(options)
  }

  // echart重新渲染
  const updateSize = () => {
    echartInstance.resize()
  }

  // 浏览器窗口变化重新渲染,宽度设为非固定值可达到响应式效果
  window.addEventListener('resize', () => {
    echartInstance.resize()
  })

  return {
    echartInstance,
    setOptions,
    updateSize
  }
}
2. 编写基类组件渲染echart实例
由使用组件者通过props传递option,echarts宽高,并设置默认值。当组件挂载到页面时渲染echart到dom元素中。
<template>
  <div class="base-echart">
    <div ref="echartDivRef" :style="{ width: width, height: height }"></div>
  </div>
</template>

<script lang="ts" setup>
import { ref, onMounted, defineProps, withDefaults, watchEffect } from 'vue'
import type{ EChartsOption } from 'echarts'
import useEchart from '../hooks/useEchart'

// 定义props
const props = withDefaults(
  defineProps<{
    options: EChartsOption
    width?: string
    height?: string
  }>(),
  {
    width: '100%',
    height: '360px'
  }
)

const echartDivRef = ref<HTMLElement>()

onMounted(() => {
  const { setOptions } = useEchart(echartDivRef.value!)
  // option的data数据设为响应式,当data改变这里会重新设置option,即重新渲染
  watchEffect(() => {
    setOptions(props.options)
  })
})
</script>

<style scoped></style>
3.饼图的封装
引入基类组件,编写饼图组件,此组件需要调用者通过props传入数据进行渲染
<template>
  <div class="pie-echart">
    <base-echart :options="options"></base-echart>
  </div>
</template>

<script setup lang="ts">
import { defineProps, computed } from 'vue'
import BaseEchart from '@/baseui/echart'

interface IDataType {
  name: string
  value: any
}

const props = defineProps<{
  pieData: IDataType[]
}>()

const options = computed<echarts.EChartsOption>(() => {
  return {
    tooltip: {
      trigger: 'item'
    },
    legend: {
      orient: 'horizontal',
      left: 'left'
    },
    series: [
      {
        name: '分类数据',
        type: 'pie',
        radius: '50%',
        data: props.pieData,
        emphasis: {
          itemStyle: {
            shadowBlur: 10,
            shadowOffsetX: 0,
            shadowColor: 'rgba(0, 0, 0, 0.5)'
          }
        }
      }
    ]
  }
})
</script>

<style scoped></style>
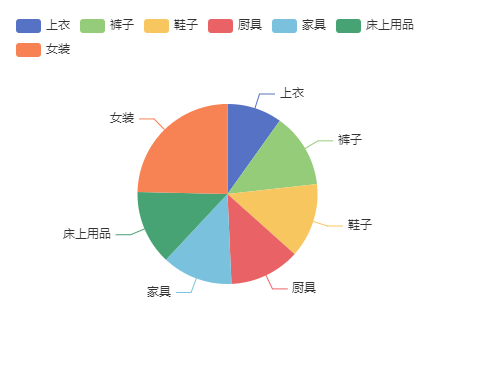
4.饼图渲染
<template>
  <div class="dashboard">
      <pie-echart :pieData="categoryGoodsCount"></pie-echart>
  </div>
</template>

<script lang="ts" setup>
import { ref } from 'vue'
import { useDashboardStore } from '@/stores/main/analysis/dashboard'

import { PieEchart } from '@/components/page-echarts'


// 获取数据
const categoryGoodsCount = ref(
    [ { "name": "上衣", "value": 14 },
    { "name": "裤子", "value": 19 },
    { "name": "鞋子", "value": 19 },
    { "name": "厨具", "value": 18 },
    { "name": "家具", "value": 18 },
    { "name": "床上用品", "value": 19 },
    { "name": "女装", "value": 35 } ]
)

/*const categoryGoodsCount = computed(() => {
  return store.categoryGoodsCount.map((item: any) => {
    return { name: item.name, value: item.goodsCount }
  })
})*/


</script>

<style scoped>
.content-row {
  margin-top: 20px;
}
</style>
5.其他图的封装
折线图
<template>
  <div class="line-echart">
    <base-echart :options="options"></base-echart>
  </div>
</template>

<script setup lang="ts">
import { computed, defineProps, withDefaults } from 'vue'
import BaseEchart from '@/baseui/echart'

const props = withDefaults(
  defineProps<{
    title?: string
    xLabels: string[]
    values: any[]
  }>(),
  {
    title: ''
  }
)

const options = computed<echarts.EChartsOption>(() => {
  return {
    title: {
      text: props.title
    },
    tooltip: {
      trigger: 'axis',
      axisPointer: {
        type: 'cross',
        label: {
          backgroundColor: '#6a7985'
        }
      }
    },
    legend: {},
    toolbox: {
      feature: {
        saveAsImage: {}
      }
    },
    grid: {
      left: '3%',
      right: '4%',
      bottom: '3%',
      containLabel: true
    },
    xAxis: [
      {
        type: 'category',
        boundaryGap: false,
        data: props.xLabels
      }
    ],
    yAxis: [
      {
        type: 'value'
      }
    ],
    series: [
      {
        name: '分别销量',
        type: 'line',
        stack: '总量',
        areaStyle: {},
        emphasis: {
          focus: 'series'
        },
        data: props.values
      }
    ]
  }
})
</script>

<style scoped></style>
数据:
{ "xLabels": [ "上衣", "裤子", "鞋子", "厨具", "家具", "床上用品", "女装" ], "values": [ 49749, 84754, 58283, 57354, 49002, 98579, 112268 ] }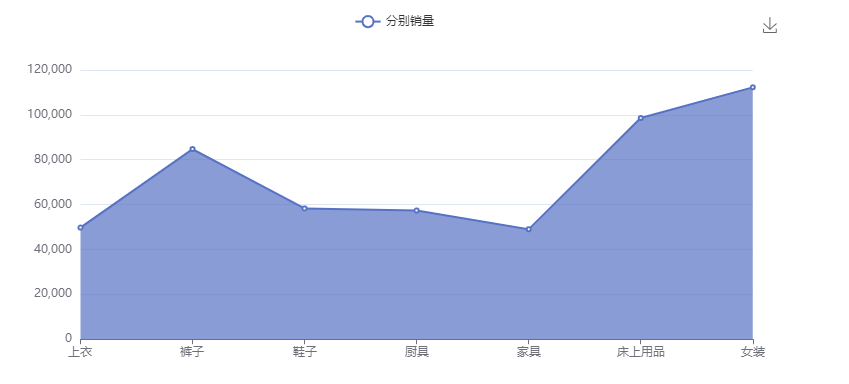
柱状图
<template>
  <div class="pie-echart">
    <base-echart :options="options"></base-echart>
  </div>
</template>

<script setup lang="ts">
import { defineProps, computed } from 'vue'
import BaseEchart from '@/baseui/echart'

interface IDataType {
  name: string
  value: any
}

const props = defineProps<{
  pieData: IDataType[]
}>()

const options = computed<echarts.EChartsOption>(() => {
  return {
    tooltip: {
      trigger: 'item'
    },
    legend: {
      orient: 'horizontal',
      left: 'left'
    },
    series: [
      {
        name: '分类数据',
        type: 'pie',
        radius: '50%',
        data: props.pieData,
        emphasis: {
          itemStyle: {
            shadowBlur: 10,
            shadowOffsetX: 0,
            shadowColor: 'rgba(0, 0, 0, 0.5)'
          }
        }
      }
    ]
  }
})
</script>

<style scoped></style>
数据
{ "xLabels": [ "上衣", "裤子", "鞋子", "厨具", "家具", "床上用品", "女装" ], "values": [ 6091, 4939, 19647, 13906, 15425, 7307, 19911 ] }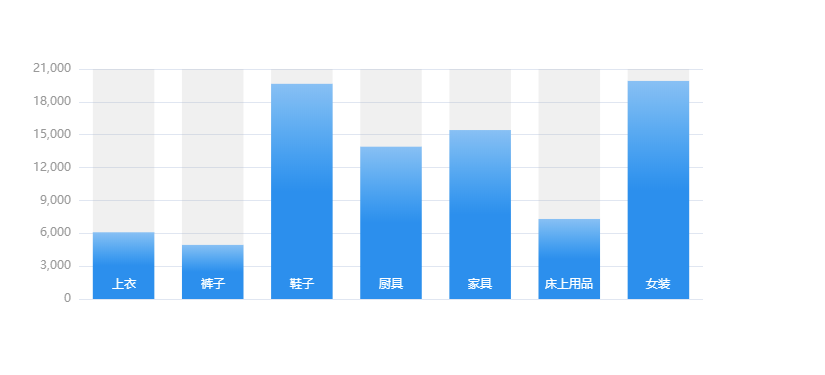
玫瑰图
<template>
  <div class="rose-echart">
    <base-echart :options="options"></base-echart>
  </div>
</template>

<script setup lang="ts">
import { computed, defineProps } from 'vue'
import BaseEchart from '@/baseui/echart'

interface IDataType {
  name: string
  value: any
}

const props = defineProps<{
  roseData: IDataType[]
}>()

const options = computed<echarts.EChartsOption>(() => {
  return {
    // legend: {
    //   top: 'bottom'
    // },
    toolbox: {
      show: true,
      feature: {
        mark: { show: true },
        dataView: { show: true, readOnly: false },
        restore: { show: true },
        saveAsImage: { show: true }
      }
    },
    series: [
      {
        name: '类别数据',
        type: 'pie',
        radius: [10, 100],
        center: ['50%', '50%'],
        roseType: 'area',
        itemStyle: {
          borderRadius: 8
        },
        data: props.roseData
      }
    ]
  }
})
</script>

<style scoped></style>
数据
[ { "name": "上衣", "value": 14 }, { "name": "裤子", "value": 19 }, { "name": "鞋子", "value": 19 }, { "name": "厨具", "value": 18 }, { "name": "家具", "value": 18 }, { "name": "床上用品", "value": 19 }, { "name": "女装", "value": 35 } ]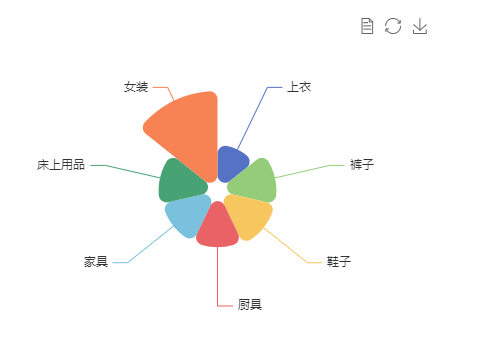
6. 地图
修改1.中的hooks
地图数据:china.json
import * as echarts from 'echarts'
// 中国地图数据
+ import chinaMapData from '../data/china.json'
// 注册中国地图
+ echarts.registerMap('china', chinaMapData as unknown as any)
封装地图
组件传入propsmapData:[ { "name": "上海", "value": 62239 }...]
<template>
  <div class="bar-echart">
    <base-echart :options="options"></base-echart>
  </div>
</template>

<script setup lang="ts">
import { computed, defineProps, withDefaults } from 'vue'
import BaseEchart from '@/baseui/echart'

interface IDataType {
  name: string
  value: any
}

// 转换函数
import { convertData } from '../utils/convert-data'

const props = withDefaults(
  defineProps<{
    title?: string
    mapData: IDataType[]
  }>(),
  {
    title: ''
  }
)

const options = computed<echarts.EChartsOption>(() => {
  return {
    backgroundColor: '#fff',
    title: {
      text: '全国销量统计',
      left: 'center',
      textStyle: {
        color: '#fff'
      }
    },
    tooltip: {
      trigger: 'item',
      formatter: function (params: any) {
        return params.name + ' : ' + params.value[2]
      }
    },
    visualMap: {
      min: 0,
      max: 60000,
      left: 20,
      bottom: 20,
      calculable: true,
      text: ['高', '低'],
      inRange: {
        color: ['rgb(70, 240, 252)', 'rgb(250, 220, 46)', 'rgb(245, 38, 186)']
      },
      textStyle: {
        color: '#fff'
      }
    },
    geo: {
      map: 'china',
      roam: 'scale',
      emphasis: {
        areaColor: '#f4cccc',
        borderColor: 'rgb(9, 54, 95)',
        itemStyle: {
          areaColor: '#f4cccc'
        }
      }
    },
    series: [
      {
        name: '销量',
        type: 'scatter',
        coordinateSystem: 'geo',
        // mapData数据为[{ "name": "上海", "value": 62239 }],需要用convertData转为
        // [{name: "上海" value: [121.48, 31.22, 62239]}],关联经纬度
        data: convertData(props.mapData),
        symbolSize: 12,
        emphasis: {
          itemStyle: {
            borderColor: '#fff',
            borderWidth: 1
          }
        }
      },
      {
        type: 'map',
        map: 'china',
        geoIndex: 0,
        aspectScale: 0.75,
        tooltip: {
          show: false
        }
      }
    ]
  }
})
</script>

<style scoped></style>
数据: name:城市,value:销量
[ { "name": "上海", "value": 62239 }, { "name": "南京", "value": 55683 }, { "name": "郑州", "value": 53716 }, { "name": "广州", "value": 6364 }, { "name": "西安", "value": 64976 }, { "name": "长沙", "value": 4142 }, { "name": "昆明", "value": 9524 }, { "name": "武汉", "value": 28212 }, { "name": "重庆", "value": 60777 }, { "name": "沈阳", "value": 20900 }, { "name": "宁波", "value": 66584 }, { "name": "苏州", "value": 1136 }, { "name": "青岛", "value": 9021 }, { "name": "成都", "value": 23378 }, { "name": "北京", "value": 6107 }, { "name": "天津", "value": 5096 }, { "name": "深圳", "value": 12480 }, { "name": "杭州", "value": 19654 } ]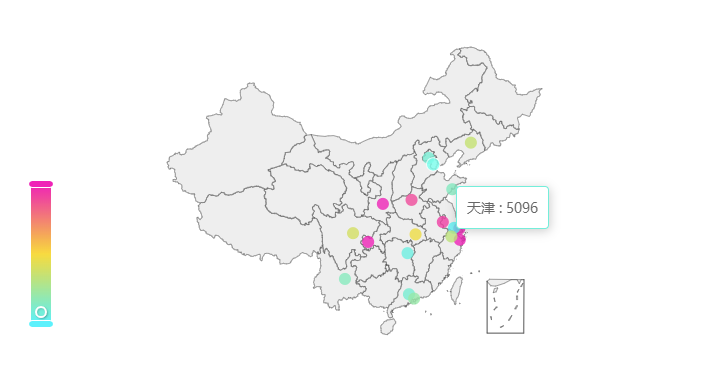
转换函数convertData
传入[{ "name": "上海", "value": 62239 }]转为[{name: "上海" value: [121.48, 31.22, 62239]}],关联经纬度
import { coordinateData } from './coordinate-data'

export const convertData = function (data: any) {
  const res = []
  for (let i = 0; i < data.length; i++) {
    const geoCoord = coordinateData[data[i].name]
    if (geoCoord) {
      res.push({
        name: data[i].name,
        value: geoCoord.concat(data[i].value)
      })
    }
  }
  console.log(res);

  return res
}coordinate-data:城市数据
export const coordinateData: any = {
  海门: [121.15, 31.89],
  鄂尔多斯: [109.781327, 39.608266],
  招远: [120.38, 37.35],
  舟山: [122.207216, 29.985295],
  齐齐哈尔: [123.97, 47.33],
  盐城: [120.13, 33.38],
  赤峰: [118.87, 42.28],
  青岛: [120.33, 36.07],
  乳山: [121.52, 36.89],
  金昌: [102.188043, 38.520089],
  泉州: [118.58, 24.93],
  莱西: [120.53, 36.86],
  日照: [119.46, 35.42],
  胶南: [119.97, 35.88],
  南通: [121.05, 32.08],
  拉萨: [91.11, 29.97],
  云浮: [112.02, 22.93],
  梅州: [116.1, 24.55],
  文登: [122.05, 37.2],
  上海: [121.48, 31.22],
  攀枝花: [101.718637, 26.582347],
  威海: [122.1, 37.5],
  承德: [117.93, 40.97],
  厦门: [118.1, 24.46],
  汕尾: [115.375279, 22.786211],
  潮州: [116.63, 23.68],
  丹东: [124.37, 40.13],
  太仓: [121.1, 31.45],
  曲靖: [103.79, 25.51],
  烟台: [121.39, 37.52],
  福州: [119.3, 26.08],
  瓦房店: [121.979603, 39.627114],
  即墨: [120.45, 36.38],
  抚顺: [123.97, 41.97],
  玉溪: [102.52, 24.35],
  张家口: [114.87, 40.82],
  阳泉: [113.57, 37.85],
  莱州: [119.942327, 37.177017],
  湖州: [120.1, 30.86],
  汕头: [116.69, 23.39],
  昆山: [120.95, 31.39],
  宁波: [121.56, 29.86],
  湛江: [110.359377, 21.270708],
  揭阳: [116.35, 23.55],
  荣成: [122.41, 37.16],
  连云港: [119.16, 34.59],
  葫芦岛: [120.836932, 40.711052],
  常熟: [120.74, 31.64],
  东莞: [113.75, 23.04],
  河源: [114.68, 23.73],
  淮安: [119.15, 33.5],
  泰州: [119.9, 32.49],
  南宁: [108.33, 22.84],
  营口: [122.18, 40.65],
  惠州: [114.4, 23.09],
  江阴: [120.26, 31.91],
  蓬莱: [120.75, 37.8],
  韶关: [113.62, 24.84],
  嘉峪关: [98.289152, 39.77313],
  广州: [113.23, 23.16],
  延安: [109.47, 36.6],
  太原: [112.53, 37.87],
  清远: [113.01, 23.7],
  中山: [113.38, 22.52],
  昆明: [102.73, 25.04],
  寿光: [118.73, 36.86],
  盘锦: [122.070714, 41.119997],
  长治: [113.08, 36.18],
  深圳: [114.07, 22.62],
  珠海: [113.52, 22.3],
  宿迁: [118.3, 33.96],
  咸阳: [108.72, 34.36],
  铜川: [109.11, 35.09],
  平度: [119.97, 36.77],
  佛山: [113.11, 23.05],
  海口: [110.35, 20.02],
  江门: [113.06, 22.61],
  章丘: [117.53, 36.72],
  肇庆: [112.44, 23.05],
  大连: [121.62, 38.92],
  临汾: [111.5, 36.08],
  吴江: [120.63, 31.16],
  石嘴山: [106.39, 39.04],
  沈阳: [123.38, 41.8],
  苏州: [120.62, 31.32],
  茂名: [110.88, 21.68],
  嘉兴: [120.76, 30.77],
  长春: [125.35, 43.88],
  胶州: [120.03336, 36.264622],
  银川: [106.27, 38.47],
  张家港: [120.555821, 31.875428],
  三门峡: [111.19, 34.76],
  锦州: [121.15, 41.13],
  南昌: [115.89, 28.68],
  柳州: [109.4, 24.33],
  三亚: [109.511909, 18.252847],
  自贡: [104.778442, 29.33903],
  吉林: [126.57, 43.87],
  阳江: [111.95, 21.85],
  泸州: [105.39, 28.91],
  西宁: [101.74, 36.56],
  宜宾: [104.56, 29.77],
  呼和浩特: [111.65, 40.82],
  成都: [104.06, 30.67],
  大同: [113.3, 40.12],
  镇江: [119.44, 32.2],
  桂林: [110.28, 25.29],
  张家界: [110.479191, 29.117096],
  宜兴: [119.82, 31.36],
  北海: [109.12, 21.49],
  西安: [108.95, 34.27],
  金坛: [119.56, 31.74],
  东营: [118.49, 37.46],
  牡丹江: [129.58, 44.6],
  遵义: [106.9, 27.7],
  绍兴: [120.58, 30.01],
  扬州: [119.42, 32.39],
  常州: [119.95, 31.79],
  潍坊: [119.1, 36.62],
  重庆: [106.54, 29.59],
  台州: [121.420757, 28.656386],
  南京: [118.78, 32.04],
  滨州: [118.03, 37.36],
  贵阳: [106.71, 26.57],
  无锡: [120.29, 31.59],
  本溪: [123.73, 41.3],
  克拉玛依: [84.77, 45.59],
  渭南: [109.5, 34.52],
  马鞍山: [118.48, 31.56],
  宝鸡: [107.15, 34.38],
  焦作: [113.21, 35.24],
  句容: [119.16, 31.95],
  北京: [116.46, 39.92],
  徐州: [117.2, 34.26],
  衡水: [115.72, 37.72],
  包头: [110, 40.58],
  绵阳: [104.73, 31.48],
  乌鲁木齐: [87.68, 43.77],
  枣庄: [117.57, 34.86],
  杭州: [120.19, 30.26],
  淄博: [118.05, 36.78],
  鞍山: [122.85, 41.12],
  溧阳: [119.48, 31.43],
  库尔勒: [86.06, 41.68],
  安阳: [114.35, 36.1],
  开封: [114.35, 34.79],
  济南: [117, 36.65],
  德阳: [104.37, 31.13],
  温州: [120.65, 28.01],
  九江: [115.97, 29.71],
  邯郸: [114.47, 36.6],
  临安: [119.72, 30.23],
  兰州: [103.73, 36.03],
  沧州: [116.83, 38.33],
  临沂: [118.35, 35.05],
  南充: [106.110698, 30.837793],
  天津: [117.2, 39.13],
  富阳: [119.95, 30.07],
  泰安: [117.13, 36.18],
  诸暨: [120.23, 29.71],
  郑州: [113.65, 34.76],
  哈尔滨: [126.63, 45.75],
  聊城: [115.97, 36.45],
  芜湖: [118.38, 31.33],
  唐山: [118.02, 39.63],
  平顶山: [113.29, 33.75],
  邢台: [114.48, 37.05],
  德州: [116.29, 37.45],
  济宁: [116.59, 35.38],
  荆州: [112.239741, 30.335165],
  宜昌: [111.3, 30.7],
  义乌: [120.06, 29.32],
  丽水: [119.92, 28.45],
  洛阳: [112.44, 34.7],
  秦皇岛: [119.57, 39.95],
  株洲: [113.16, 27.83],
  石家庄: [114.48, 38.03],
  莱芜: [117.67, 36.19],
  常德: [111.69, 29.05],
  保定: [115.48, 38.85],
  湘潭: [112.91, 27.87],
  金华: [119.64, 29.12],
  岳阳: [113.09, 29.37],
  长沙: [113, 28.21],
  衢州: [118.88, 28.97],
  廊坊: [116.7, 39.53],
  菏泽: [115.480656, 35.23375],
  合肥: [117.27, 31.86],
  武汉: [114.31, 30.52],
  大庆: [125.03, 46.58]
}
Ценники на вывоз мусора сейчас космос, любые лайфхаки по экономии в тему.
1xbet onlayn kazino platforması ilə vaxtınızı daha səmərəli və maraqlı keçirin. Saytın canlı kazino bölməsi istifadəçilərə fərqli bir dünya təklif edir. Burada canlı dilerli kazino oyunlarının hər bir növünü sınaqdan keçirə bilərsiniz. Krupyelərin peşəkarlığı oyunun dinamikasını və marağını artırır. Müntəzəm olaraq yenilənən oyun siyahısı cansıxıcılığa yol vermir. Hesabınızı artırmaq üçün onlarla fərqli və etibarlı üsul mövcuddur. Qazanılan pullar cəmi bir neçə dəqiqə ərzində şəxsi hesabınıza köçürülür. Aktiv fəaliyyətinizə görə fərdi bonuslar və hədiyyələr qazana bilərsiniz. Dəstək xidməti həm çat, həm də e-poçt vasitəsilə kömək göstərir. 1xbet ailəsinə qoşulun və böyük uduşlar üçün ilk addımı atın. onlayn kazino
我一直梦想, 看到你们相册那样的地方。真棒。
我喜欢, 这里分享真实经验。你的项目 就是 属于这里的。请继续。
我热爱这样的想法, 去那么多国家。真的很鼓舞。
能感受到热爱。继续保持 感受。
我关注这样的资源, 写得很实在。你的网站 就是 属于这里的。加油。
1
1
1